User Guide
The Solar PV plus Storage Sizing Tool helps the user explore the energy storage sizing and estimated costs of a hybrid solar and battery energy storage system that meet the generation requirements for both smoothing and shifting applications.
Smoothing
Solar energy output smoothing refers to when the Battery Energy Storage System (BESS) is used to neutralize fluctuations in solar power output, thus facilitating its integration into the grid. This means that the hybrid solar plus storage system can provide steady power output over a desired time window, usually a period of minutes to hours, providing the necessary time for other generating units to respond. Solar output smoothing is equivalent to providing reserves only to address the variability and uncertainty of the solar PV plant. Batteries used for smoothing, requiring 30 minutes output duration or less, will not critically affect the economics of the plant.
Here is a worked example of the application of the Smoothing application. See also the inputs and outputs for detailed descriptions of the parameters.


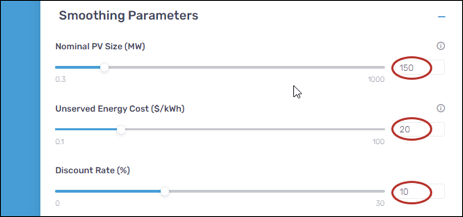
The results, displayed on the right, will update in real time as you enter each of the parameters, but once you have entered them all, you should see the following:
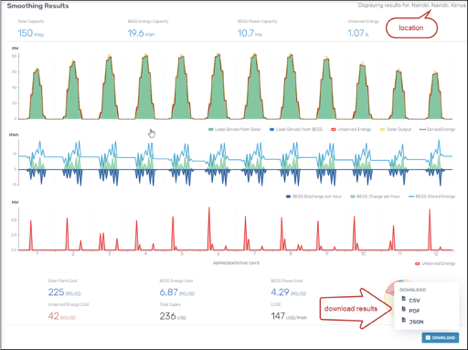
At the top of the screen, you will see the size of the main elements integrating the system. The solar PV capacity is the one predetermined by the user, while the battery component is sized to meet the smoothing period required. The unserved energy indicates the percentage of energy not supplied by the hybrid system due to the constraints entered or because it is uneconomical. The graphs show the results over a year period, with the varying levels of solar power using 12 representative days. It shows the BESS providing additional power once the load can no longer be served by solar power alone. The battery charge, discharge and stored energy are depicted in the second graph. The third graph depicts the unserved energy from the first graph in more detail.
The bottom of the screen depicts a summary of the total cost of the solution. It shows the cost broken down by the capital cost of the different components (solar PV, battery energy and battery capacity), the cost of unserved energy and estimates a levelized cost of electricity (LCOE) for the solution in USD/MWh. A pie chart which depicts the breakdown of total costs. A detailed description of these cost figures is available in the “Inputs and Outputs” section. These results can be exported on three different formats: PDF, CSV and JSON.
The sizing of this hybrid system is based on a high-level representation of the varying levels of solar power using twelve representative days. This analysis does not substitute a pre-feasibility or feasibility study for a hybrid solar PV and battery storage system.
Shifting
Solar energy output shifting, refers to the use of batteries to meet energy demand periods that cannot be met by solar generation alone (typically between dusk and dawn) . The BESS is charged during hours when solar energy generation is available and discharged to meet the demand profile defined by the user. Solar energy shifting adapts the project output to a given demand profile, thus increasing the availability of round-the-clock power. Typically it involves increasing the size of both the solar field and the battery.
Here is a worked example of the application of the Shifting function, including setting the user-defined demand profile. See also the inputs and outputs for detailed descriptions of the parameters.
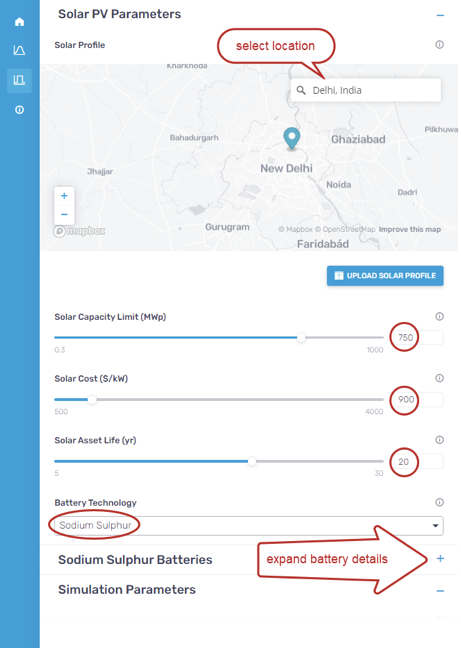
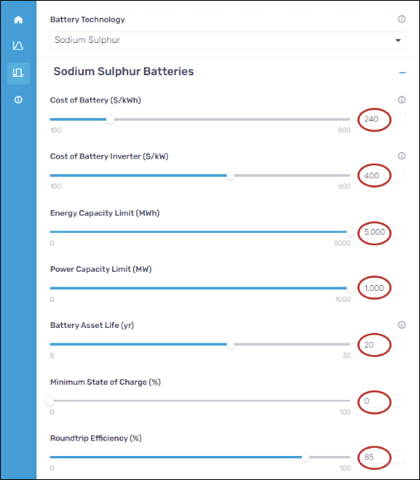
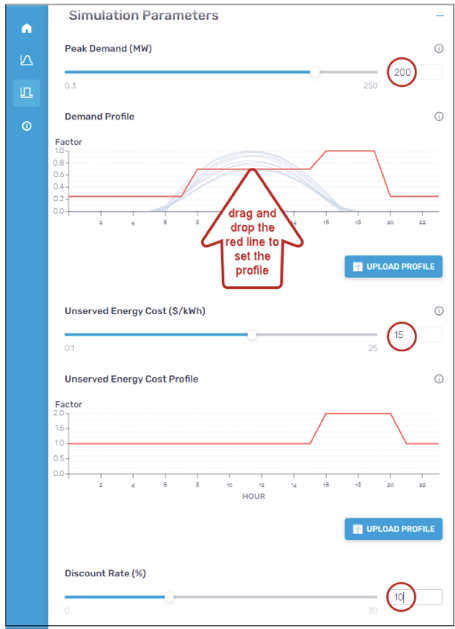

The results, displayed on the right, will update as you enter each of the parameters, but once you have entered them all, you should see the following:
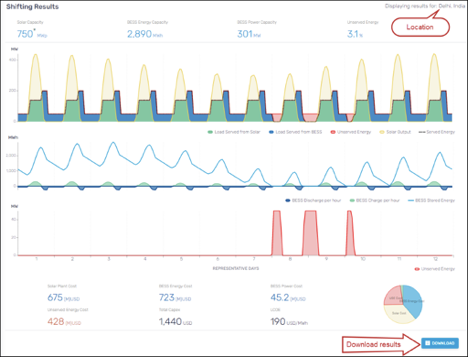
At the top of the screen, you will see the size of the system, solar PV and battery components, necessary to meet the demand profile required. The unserved energy indicates the percentage of energy not supplied by the hybrid system due to the constraints entered or because it is uneconomical.
The first timeline shows the results over a year period, with the varying levels of solar power using 12 representative days. The battery charge, discharge and stored energy are depicted in the second graph. The third graph depicts the unserved energy from the first graph in more detail.
Below the graphs are displayed a summary of the total cost of the solution. It shows the cost broken down by the capital cost of the different components (solar PV, battery system energy component and battery system power component), the cost of unserved energy and estimates a levelized cost of electricity (LCOE) for the solution in USD/MWh. A pie chart depicts the breakdown of total costs. A detailed description of these cost figures is available in the “Inputs and Outputs” section. These results can be exported on three different formats: PDF, CSV and JSON. See export formats for details on the CSV and JSON exports.
The sizing of this hybrid system is based on a high-level representation of the varying levels of solar power using twelve representative days. This analysis does not substitute a pre-feasibility or feasibility study for a hybrid solar PV and battery storage system.